Leverage advanced analytics and digital reporting to improve productivity, profitability, and site safety
Managing infrastructure constructionInfrastructure construction refers to the process of designing, planning, and building physical structures and facilitie… More projects is complex at the best of times. As project demand grows and the skill shortage continues, it’s critical to increase productivity, avoid reworks, and enhance communication between the office and the field. Frequent data capture coupled with automated and digital reporting tools lighten the project managers’ load and support stakeholders at every point of the project lifecycle — enabling optimized operations, ensuring timely and accurate payments, and driving successful project outcomes.
With DatuBIM, all construction data is automatically stored in the cloud, allowing data-based decision-making and comprehensive project analysis. Historical data and retroactive reports provide actionable insights into areas where changes need to be made or help resolve disputes that may arise during or after project completion.
Our comprehensive reports provide you with the quality assurance “proof” you need to show that your projects are proceeding as planned and that actual results are in line with design. By adhering to designer specifications, contractors can effectively complete projects, achieve the desired outcomes, and meet the required standards.
Powering decision-making for complex infrastructure and civil construction across the project lifecycle


Example
Background
- The design, planning and construction of large highway intersections come with multiple challenges.
- In the case of a complex highway section, this was made even more challenging as the project involves more that 15 roads including bridges, tunnels, off-ramps and on-ramps.
- Each road within this intersection project boasts a distinctive design, tailored to meet specific requirements for design strength and usability. These unique designs are essential for the overall functionality of the intersection.
Solution
- The company managing this project used DatuBIM to monitor its progress.
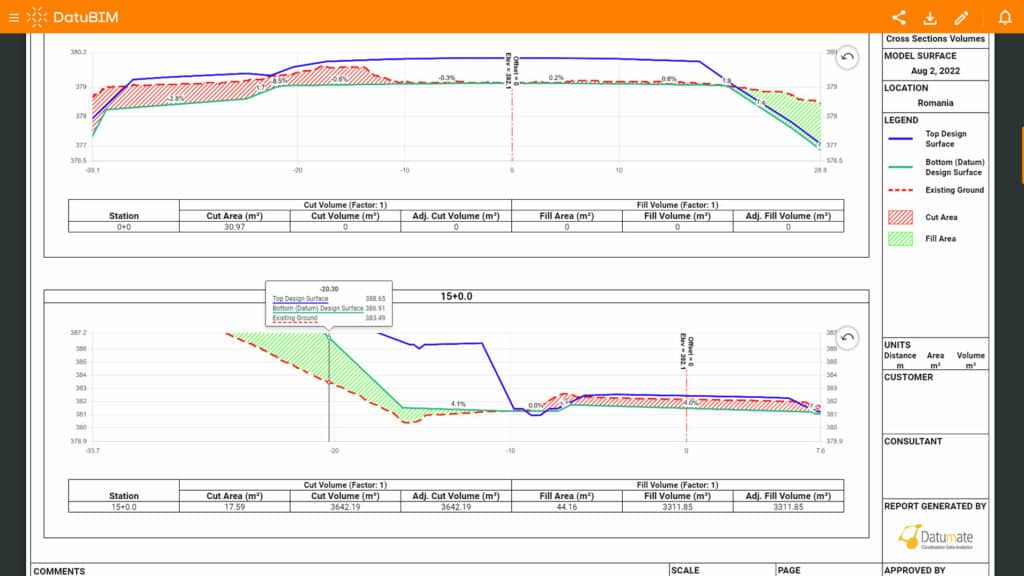
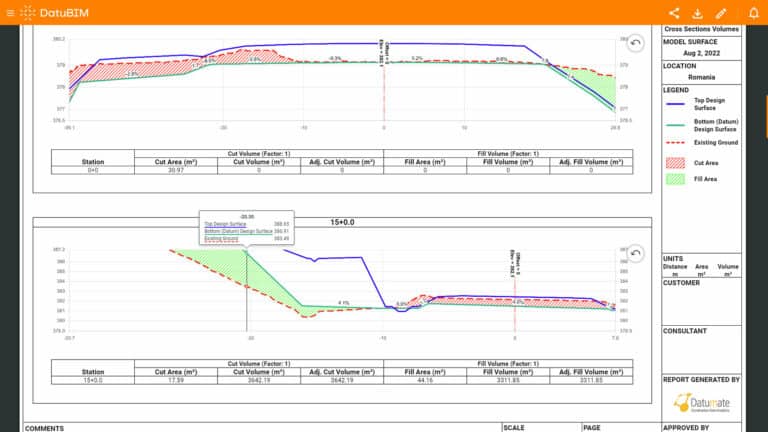
- One of the main reports used was the Cross-Section Volume report.
- This report can be generated quickly and shows the volume calculation for every section required.
- The report includes all the information that is normally included in a professional surveyor report.
Results
- With this report, which also includes a dynamic view that can be accessed via our cloud-based platform, all stakeholders quickly receive the accurate information they need to closely monitor projects – without having to be onsite.
- This leads to major time and cost savings.
Volume grid and heatmap reports
- Achieve accuracy in earthworks for infrastructure developments
- Access survey-grade data on volume that considers factors such as slope and distance
- Easily generate volume grid and heatmap reports in under one hour
- Automatically calculate the volume of the terrain to every 2 cm of the site, and present the data in a grid format based on the user’s preferred measurement units
- Easily visualize changes in elevation at a glance and observe and analyze alterations in cut and fill areas
- Compare any two designs and receive a precise volume calculation for any pile
- Track progress and assess productivity by comparing two specific dates
- Estimate resource investment or quantify inventory by comparing the current terrain against the final design
Cross-section volume reports
- Easily track and measure the progress of each road section
- Use this information to accurately calculate compensation based on completed milestones
- Easily visualize and understand road design, collaborate with all stakeholders and enhance project efficiency
- Replace guesswork with verifiable and consistent progress reports
Grade checking reports
- Generate grade checking reports to quickly identify any discrepancies by viewing the height differences that exist between the design and the actual
- Evaluate whether there are gaps between layers that need to be filled, or sections need to be cut due to excessive material on a particular layer in a specific area
- Use the color-coded, easy-to-read list of measured points to quickly identify any problem areas that need to be rectified