
Infrastructure construction management – then and now
When you think about project management in infrastructure constructionInfrastructure construction refers to the process of designing, planning, and building physical structures and facilitie… More, it’s hard to imagine getting the job done without our trusty old friends: pen and paper. However, as the demand for projects increases and the skill shortage continues, stakeholders need to find ways to combat low productivity, high rework rates, and misunderstandings between those in the office and those in the field. When left unchecked, these factors can significantly impact productivity, profitability, and site safety.
One of the ways to overcome these challenges is through frequent data capture, together with automated and digital reporting tools. Through digital and agile process changes, the right automated reports can make all the difference to project managers, relieving the heavy administrative burden that steals valuable hours from the day.
On a day-to-day basis, digital reporting tools can support stakeholders across the project lifecycle in optimizing operations, getting paid accurately and on time, and driving successful project outcomes overall, regardless of the kind of project.
Achieving accuracy in earthworks for infrastructure developments
Consider a complex infrastructure development for a residential neighborhood, where a significant focus will be on earthworksEarthworks are an essential part of modern infrastructure and are used in a variety of industries including construction… More. Whether it involves leveling the ground, creating parks, constructing reservoirs or sewage systems, or planning and implementing utilities — tracking and measuring earthworksEarthworks are an essential part of modern infrastructure and are used in a variety of industries including construction… More activities is key.
Traditionally, measuring the cut and fill rates in a project like this and generating a professional report would require complex software and deep expertise. Even with these resources, it could take 1-2 weeks to accurately compare cut and fill to an existing baseline. This delay in obtaining the report could result in postponed payments crucial for the project’s progress or critical decisions being put on hold.
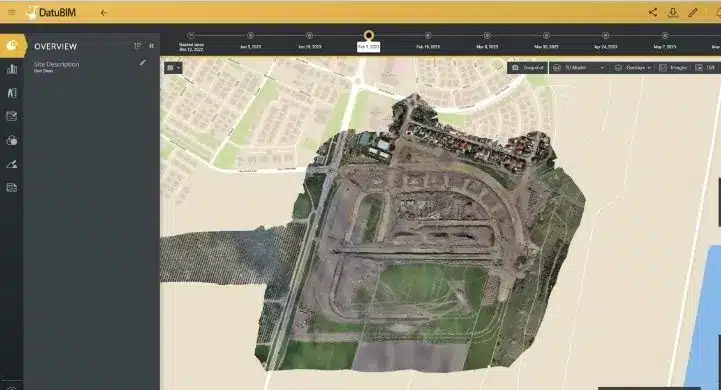
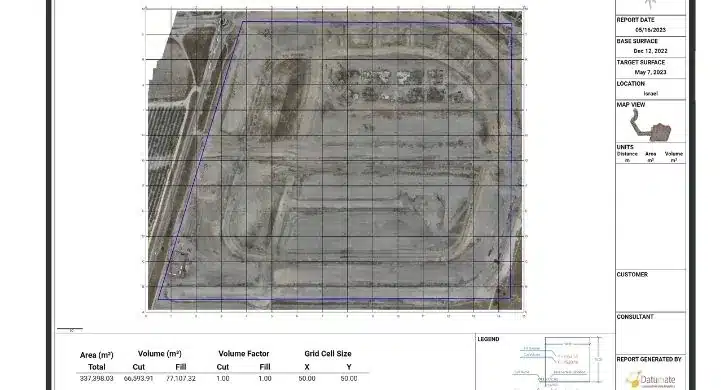
At DatuBIM, our volume grid and heatmap report can generate the required report in under one hour. It calculates the volume of the terrain to every 2cm of the site, presenting the data in a grid format based on the user’s preferred measurement units.
This innovative approach transforms raw drone data into accurate insights, providing survey-grade data on volume that considers factors such as slope and distance. Contractors can generate a comprehensive report in a fraction of the time, ensuring they are paid accurately based on the amount of earth moved. The report can be white-labeled with the contractor’s own logo and customer name, adding a professional touch.
All stakeholders need to do is select the surface area, specify the report parameters, and choose the flights to be compared. With a simple click of a button, the report is generated. Users can compare any two designs and receive a precise volume calculation for any pile. This level of accuracy allows for various applications, such as tracking progress and assessing productivity by comparing two specific dates or estimating resource investment or quantifying inventory by comparing the current terrain against the final design.
This report also generates a heatmap, which enables users to easily visualize changes in elevation at a glance, and to observe and analyze alterations in cut and fill areas. Additionally, the report provides a sidebar on the right-hand side where users can access detailed information. In the screenshot below, the color yellow indicates untouched land, red represents filled areas, and blue highlights cut areas. However, users have the flexibility to customize the color system according to their preferences.
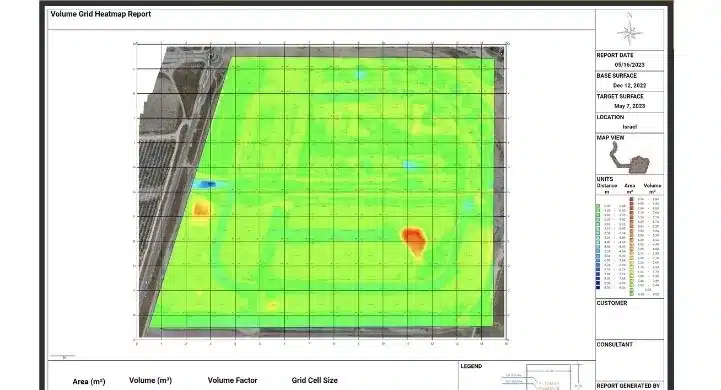
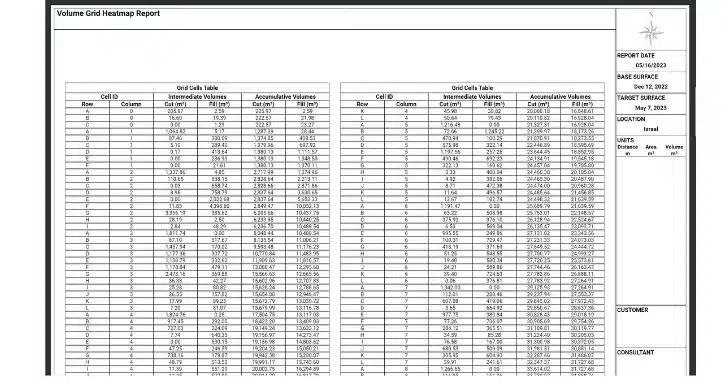
Each cell in the report is labeled with a unique combination of a number and a letter, allowing stakeholders to identify the specific area being highlighted. Additionally, with the volume calculations provided, site owners can have a clear understanding of what they need to pay for on-site. The reports are presented in a format that is widely accepted in the industry, ensuring compatibility and ease of use.
By utilizing a digital construction platform, data is automatically stored in the cloud. This eliminates the need for immediate action or decision-making. Reports can be generated retroactively, providing greater insight into areas where changes can be made or resolving unexpected disputes that may arise after the fact. The availability of historical data allows for a comprehensive analysis of the project, facilitating informed decision-making and efficient issue resolution.
Supporting teams in working faster and smarter for complex roads and rails
When it comes to constructing roads, railways, and highways, stakeholders require a distinct approach. These projects involve layering various materials, and in the case of complex intersections, there can be a significant number of roads involved, including bridges, tunnels, and other specialized components. Contractors are typically compensated based on the completion of roads, with the road designer specifying the necessary layers and materials to be used.
In this context, it becomes essential to accurately track and measure the progress of each road section. This allows for proper payment calculation based on the completed milestones. The road designer’s specifications play a crucial role in ensuring that the construction meets the required standards and quality. By adhering to these specifications, contractors can effectively complete the roads and achieve the desired outcome.
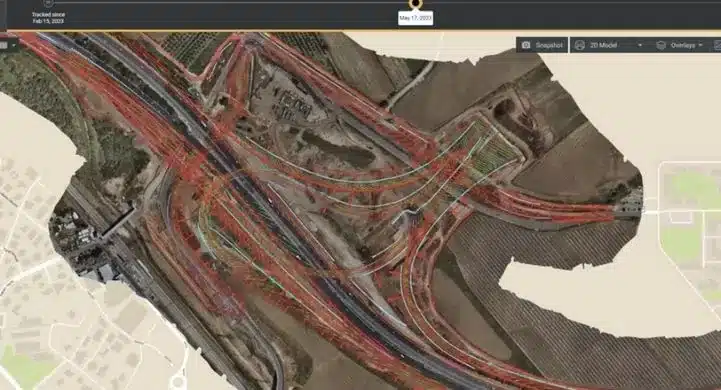
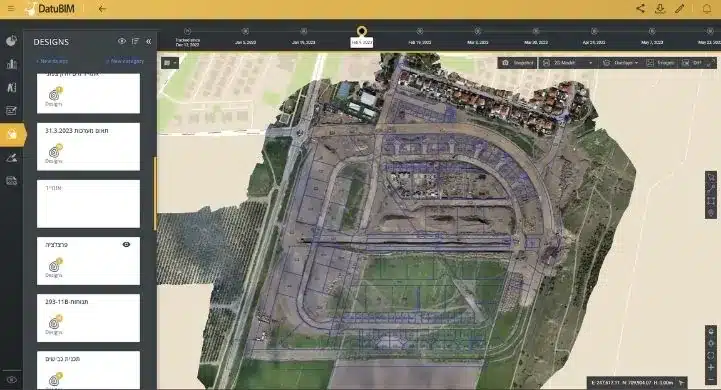
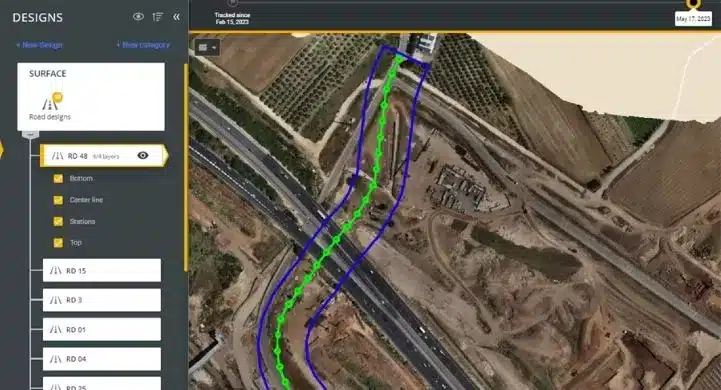
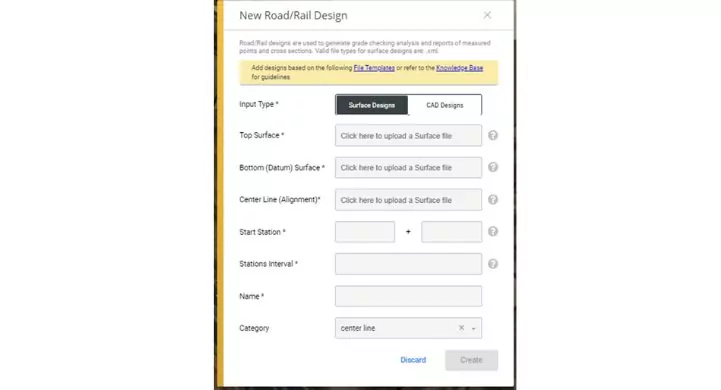
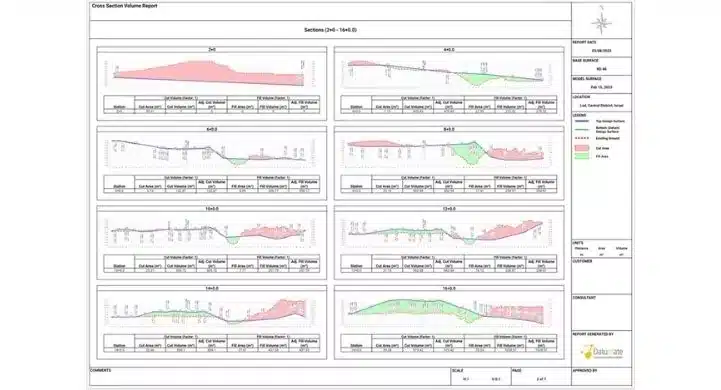
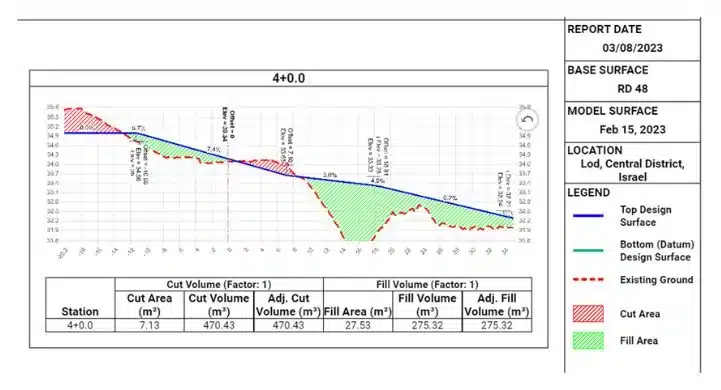
In this particular use case, DatuBIM’s cross-section report proves to be the ideal solution. As depicted in the example below, the road design is accurately represented through the inclusion of a top surface, bottom surface, and center alignment number provided at regular intervals of 20 meters. Each alignment number corresponds to a specific section of the road. This standardized representation establishes a common language among surveyors, foremen, and project managers, facilitating streamlined operations and ensuring clear and precise communication throughout the project lifecycle. The cross-section report enables stakeholders to visualize and understand the road design effectively, promoting collaboration and enhancing project efficiency.
Once the desired area and baseline for comparison have been selected, the cross-section report provides an accurate depiction of the amount of material that has been added or excavated. By calculating the fill or cut on a section-by-section basis, stakeholders gain an objective view of the precise volume and the proximity to the top surface. This professional report becomes a valuable tool for ensuring accurate and timely payment or for dynamically assessing project progress.
By relying on the cross-section report, your team replaces guesswork with verifiable and consistent progress reports. This shift enables stakeholders to have a reliable source of information, empowering them to make informed decisions and take necessary actions based on factual data. The objective view provided by the report fosters transparency, accountability, and efficiency throughout the construction process.
Both the cross-section report and the volume and heat map report serve as valuable tools for construction teams to swiftly assess progress, identify potential issues, and uncover opportunities. Instead of relying on cumbersome Excel spreadsheets, Word documents, or emails, the information can be conveniently accessed within the platform itself or downloaded as a PDF in the appropriate structure and format. This flexibility allows for seamless collaboration among all stakeholders, with all the necessary data available from one centralized location.
By utilizing these reports, construction teams can easily share and communicate project updates, ensuring that everyone involved has access to accurate and up-to-date information. This streamlined approach enhances collaboration, reduces communication gaps, and facilitates a more efficient decision-making process. Whether viewing the reports within the platform or sharing them externally, stakeholders can rely on a centralized hub for comprehensive project visibility and improved collaboration.
Streamline construction operations with digital reporting
Reporting has always played a crucial role in construction projects, but the traditional approach is often resource-intensive and prone to errors. However, automated reporting through a digital construction platformDigital construction platforms are used to streamline and optimize construction processes using digital technology. They… More offers several significant advantages:
- Objectivity. The platform provides a single, reliable source of truth for all on-site activities, eliminating discrepancies and ensuring accurate reporting.
- Consistency. Stakeholders anywhere in the world can generate the same survey-grade reports, maintaining consistency and enabling effective collaboration.
- Accuracy. By delivering the right reports to the appropriate stakeholders, the digital platform ensures that teams are paid accurately based on the work completed.
- Visibility. All stakeholders, regardless of their location, can access an accurate view of the project’s progress and upcoming steps, promoting transparency and informed decision-making.
- Safety. Construction is a high-risk industry, but accurate reports significantly reduce errors in the field, enhancing overall safety measures.
- Efficiency. The use of a digital platform automates the reporting process, saving project managers weeks of time as reports are generated within an hour. This time-saving benefit allows managers to focus on more critical tasks and increases overall project efficiency.
By leveraging automated reporting in the construction industry, stakeholders can streamline operations, enhance safety, improve accuracy, and ultimately achieve greater project success.


